This blog covers a proof of concept, which shows how to monitor Apache Airflow using Prometheus and Grafana.
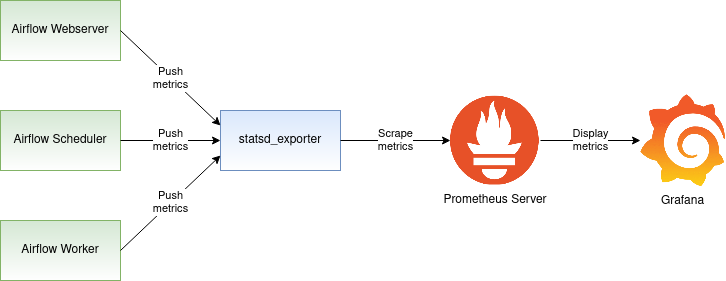
Airflow monitoring diagram
Let’s discuss the big picture first. Apache Airflow can send metrics using the statsd protocol. These metrics would normally be received by a statsd server and stored in a backend of choice. Our goal though, is to send the metrics to Prometheus. How can the statsd metrics be sent to Prometheus? It turns out that the Prometheus project comes with a statsd_exporter that functions as a bridge between statsd and Prometheus. The statsd_exporter receives statsd metrics on one side and exposes them as Prometheus metrics on the other side. The Prometheus server can then scrape the metrics exposed by the statsd_exporter. Overall, the Airflow monitoring diagram looks as follows:

The diagram depicts three Airflow components: Webserver, Scheduler, and the Worker. The solid line starting at the Webserver, Scheduler, and Worker shows the metrics flowing from the Webserver, Scheduler, and the Worker to the statsd_exporter. The statsd_exporter aggregates the metrics, converts them to the Prometheus format, and exposes them as a Prometheus endpoint. This endpoint is periodically scraped by the Prometheus server, which persists the metrics in its database. Airflow metrics stored in Prometheus can then be viewed in the Grafana dashboard.
The remaining sections of this blog will create the setup depicted in the above diagram. We are going to:
- configure Airflow to publish the statsd metrics
- convert the statsd metrics to Prometheus metrics using statsd_exporter
- deploy the Prometheus server to collect the metrics and make them available to Grafana
By the end of the blog, you should be able to watch the Airflow metrics in the Grafana dashboard. Follow me to the next section, where we are going to start by installing Apache Airflow.
Enabling statsd metrics on Airflow
In this tutorial, I am using Python 3 and Apache Airflow version 1.10.12. First, create a Python virtual environment where Airflow will be installed:
| |
Activate the virtual environment:
| |
Install Apache Airflow along with the statsd client library:
| |
Create the Airflow home directory in the default location:
| |
Create the Airflow database and the airflow.cfg configuration file:
| |
Open the Airflow configuration file airflow.cfg for editing:
| |
Turn on the statsd metrics by setting statsd_on = True. Before saving your changes, the statsd configuration should look as follows:
| |
Based on this configuration, Airflow is going to send the statsd metrics to the statsd server that will accept the metrics on localhost:8125. We are going to start that server up in the next section.
The last step in this section is to start the Airflow webserver and scheduler process. You may want to run these commands in two separate terminal windows. Make sure that you activate the Python virtual environment before issuing the commands:
| |
At this point, the Airflow is running and sending statsd metrics to localhost:8125. In the next section, we will spin up statsd_exporter, which will collect statsd metrics and export them as Prometheus metrics.
Converting statsd metrics to Prometheus metrics
Let’s start this section by installing statsd_exporter. If you have the Golang environment properly set up on your machine, you can install statsd_exporter by simply issuing:
| |
Alternatively, you can deploy statsd_exporter using the prom/statsd-exporter container image. The image documentation includes instructions on how to pull and run the image.
While Airflow is running, start the statsd_exporter on the same machine:
| |
If everything went okay, you should see the Airflow metrics rolling on the screen, as in the above example. You can also verify that the statsd_exporter is doing its job and exposes the metrics in the Prometheus format. The Prometheus metrics should be reachable at localhost:9102. You can use curl to obtain the Prometheus metrics:
| |
Collecting metrics using Prometheus
After completing the previous section, the Airflow metrics are now available in the Prometheus format. As a next step, we are going to deploy the Prometheus server that will collect these metrics. You can install the Prometheus server by running the command:
| |
Note that a working Golang environment is required for the above command to succeed. Instead of installing Prometheus from the source, you can choose to use the existing Prometheus container image instead.
The minimum Prometheus configuration that will collect the Airflow metrics looks like this:
| |
It instructs the Prometheus server to scrape the metrics from the endpoint localhost:9102 periodically. Save the above configuration as a file named prometheus.yml and start the Prometheus server by issuing the command:
| |
You can now use your browser to go to the Prometheus built-in dashboard at http://localhost:9090/graph and check out the Airflow metrics.
Displaying metrics in Grafana
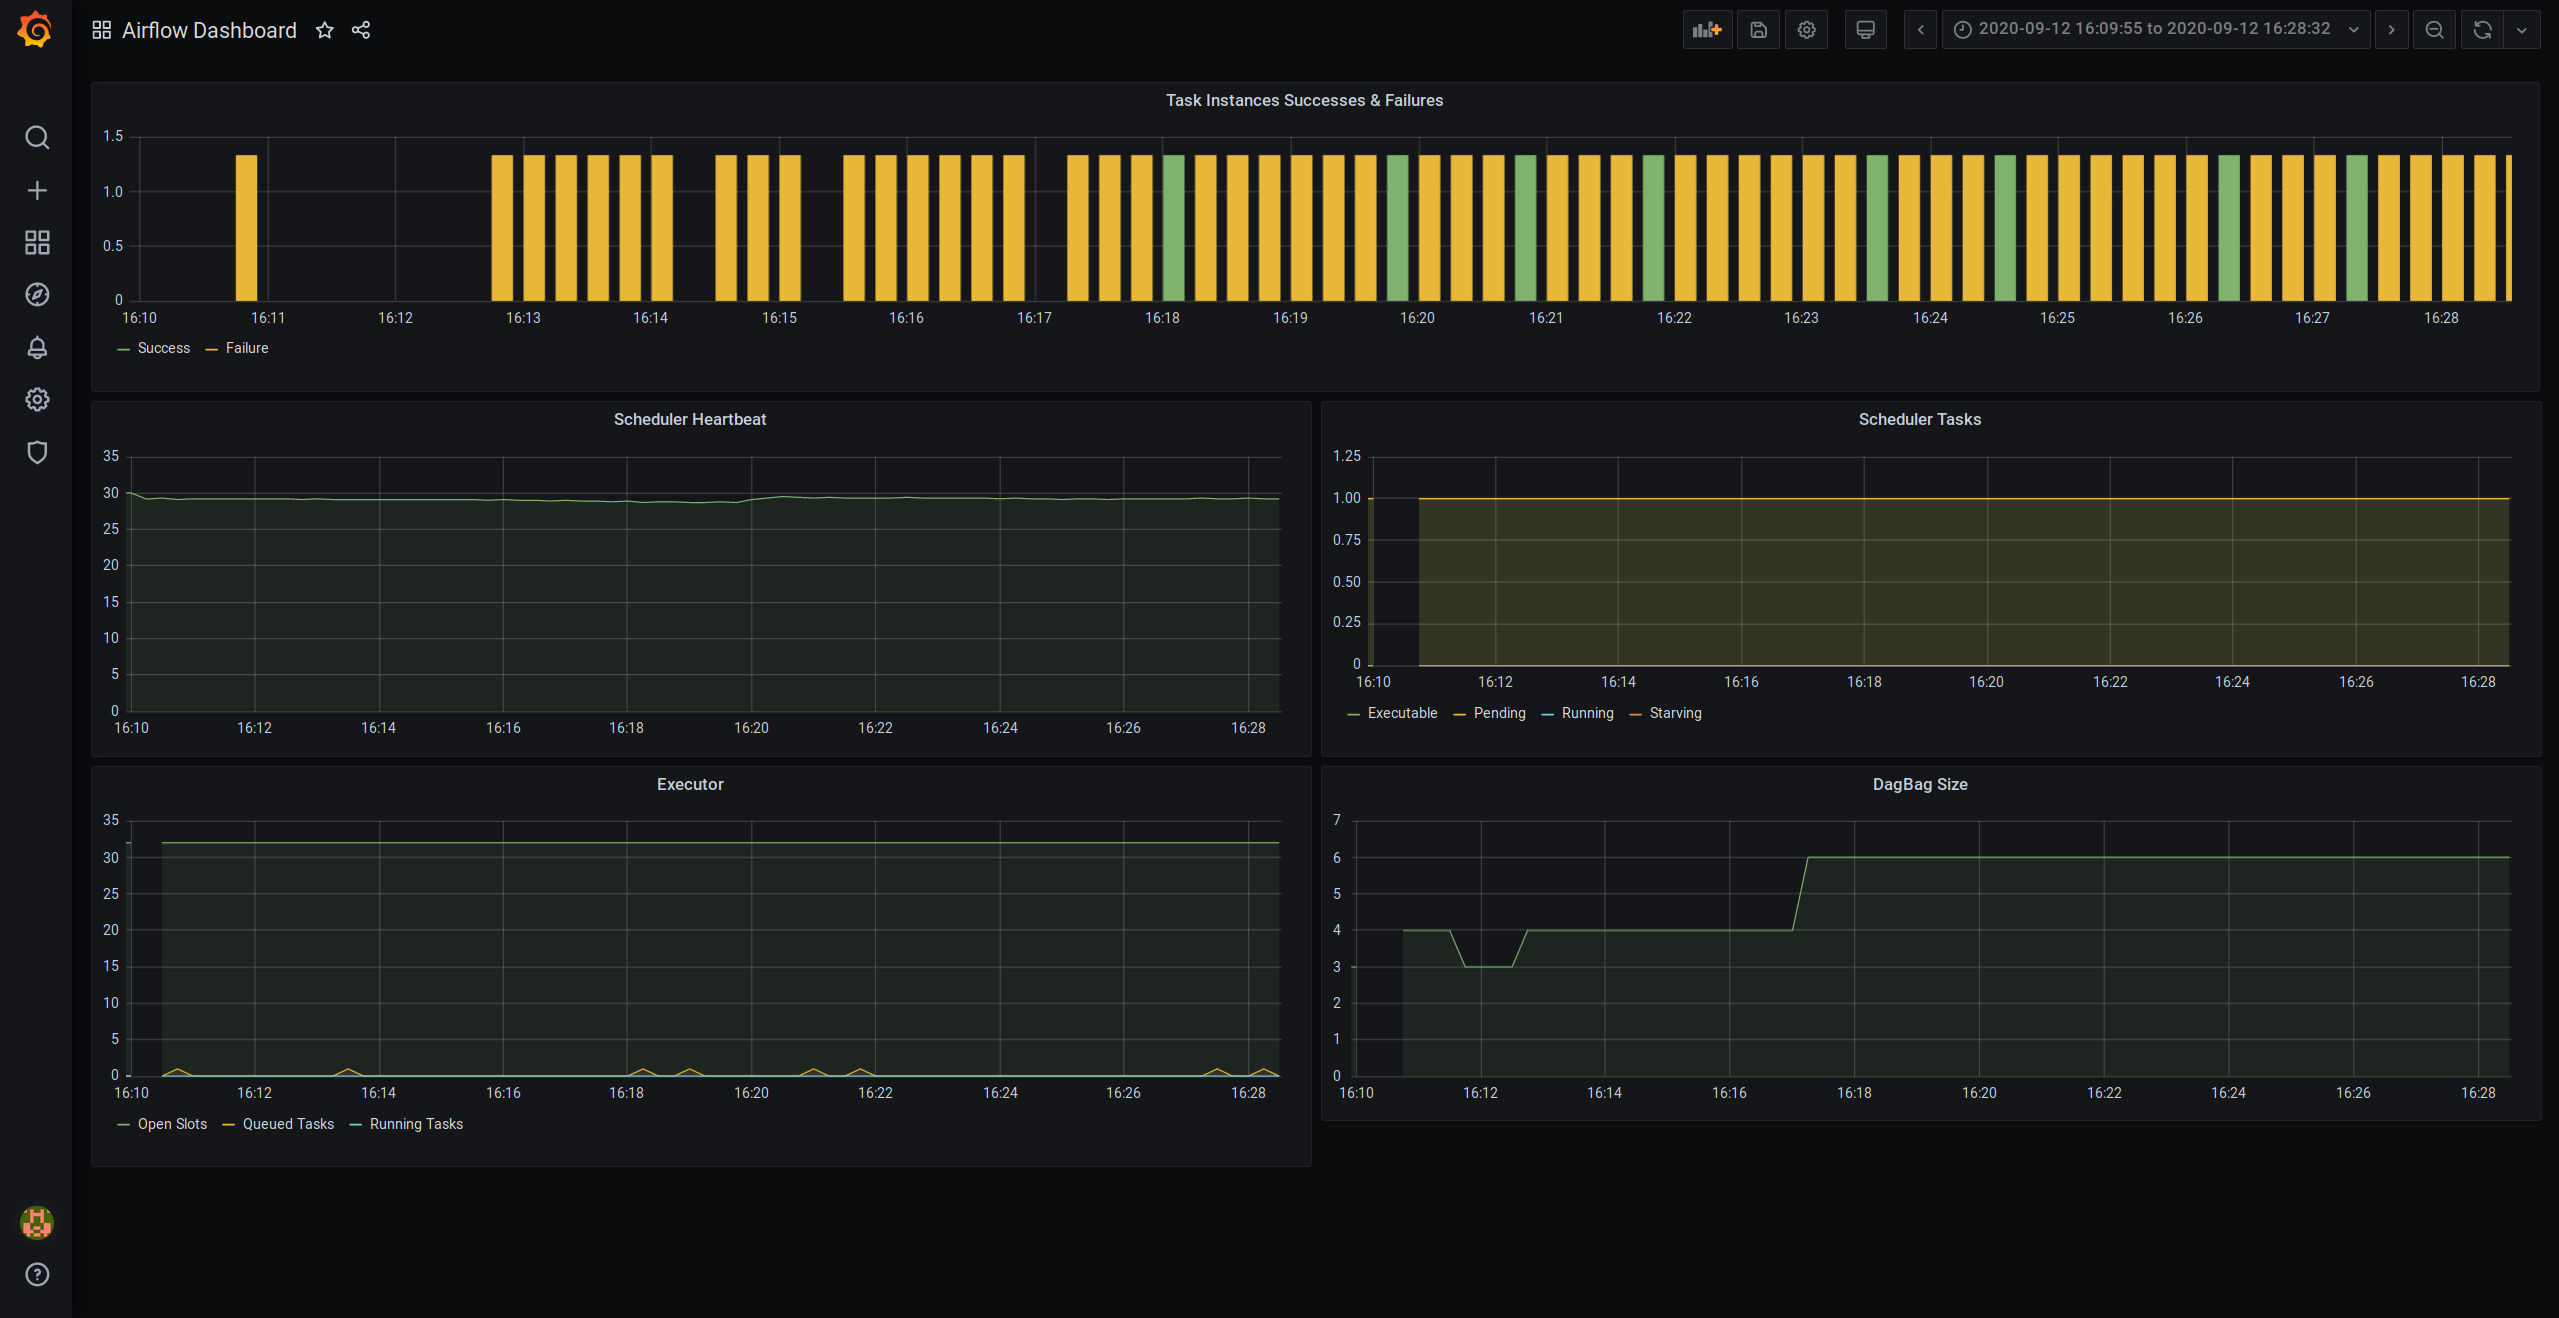
Finally, we are going to display the Airflow metrics using Grafana. Interestingly enough, I was not able to find any pre-existing Grafana dashboard for Airflow monitoring. So, I went ahead and created a basic dashboard that you can find on GitHub. This dashboard may be a good start for you. If you make further improvements to the dashboard that you’d like to share with the community, I would be happy to receive a pull request. Currently, the dashboard looks like this:

Conclusion
In this post, we deployed a proof of concept of Airflow monitoring using Prometheus. We deployed and configured Airflow to send metrics. We leveraged statsd_exporter to convert the metrics to the Prometheus format. We collected the metrics and saved them in Prometheus. Finally, we displayed the metrics on the Grafana dashboard. This proof of concept was spurred by my search for a way to monitor Apache Airflow, and it may be a good starting point for you. If you make further improvements to the dashboard that you’d like to share with the community, I would be happy to receive a pull request.
I hope you enjoyed this blog. If you have any further questions or comments, please leave them in the comment section below.
