If you don’t monitor it, it’s not in production! To get an OpenStack cloud ready for production, monitoring is a must. Let’s take a look at two projects providing Nagios/Icinga plugins for checking the health of OpenStack services.
First, a few words about Icinga. I started using Icinga 2 only recently and I’m very pleased with this flexible and well-documented software. I’ve listened to a German presentation about Icinga where they said that Icinga was not that widely spread in the US as it was the case in Europe. Dear Icinga team, you have one more happy user in the US now. Your software just works and your web GUI is beautiful.
I found two very useful projects for monitoring the OpenStack APIs both hosted on GitHub:
OpenStack Nagios Plugins
OpenStack Nagios Plugins provides a collection of checks for the OpenStack services Nova, Neutron, Cinder, Keystone and Ceilometer. Available plugins worked right away with my OpenStack Liberty cluster. The Nova Hypervisor check monitors the “virtual” CPU and memory usage across your compute nodes. The name virtual CPU is a little misleading here. In reality, the number of physical cores is monitored as the Nova API actually reports the number of physical cores. I stick to the OpenStack default settings that overcommit the CPUs by factor of 16 and the memory by factor of 1.5. To accommodate this fact, I changed the warning and critical ranges for the check_nova-hypervisors plugin as follows:
| |
Monitoring for OpenStack
Plugins coming with the [Monitoring for OpenStack](( https://github.com/openstack/monitoring-for-openstack) project provide deeper checks of OpenStack functionality. I liked the following ones the best:
check_nova_instance: Creates an instance on your cloud and deletes it again as soon as it is active. It’s recommended to use a small disk image like cirros for this check.cinder_volume: Allocates a volume of size 1GB and deletes it again.neutron_floating_ip: Tries to allocate a floating IP. You have to configure the network where to allocate the IP from.glance_upload: Uploads 1MB of data as an image into Glance.check_horizon_login: Given a user name and a password the plugin will log into the Horizon dashboard.
Some of the plugins didn’t work for me due to incompatibilities with the Liberty client APIs. If you encounter the same problem you can try out my fixed version of the plugins on GitHub here.
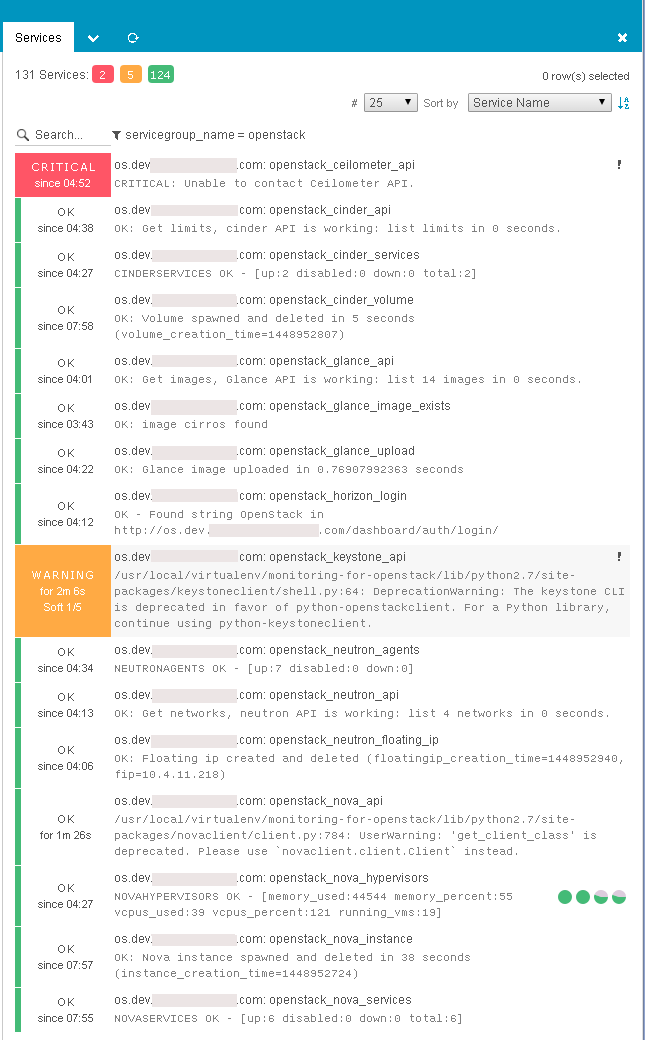
Icinga 2 Screenshot
And this is how the OpenStack APIs service group looks in Icinga Web 2. Happy monitoring!